Applications Home Page
Power BI
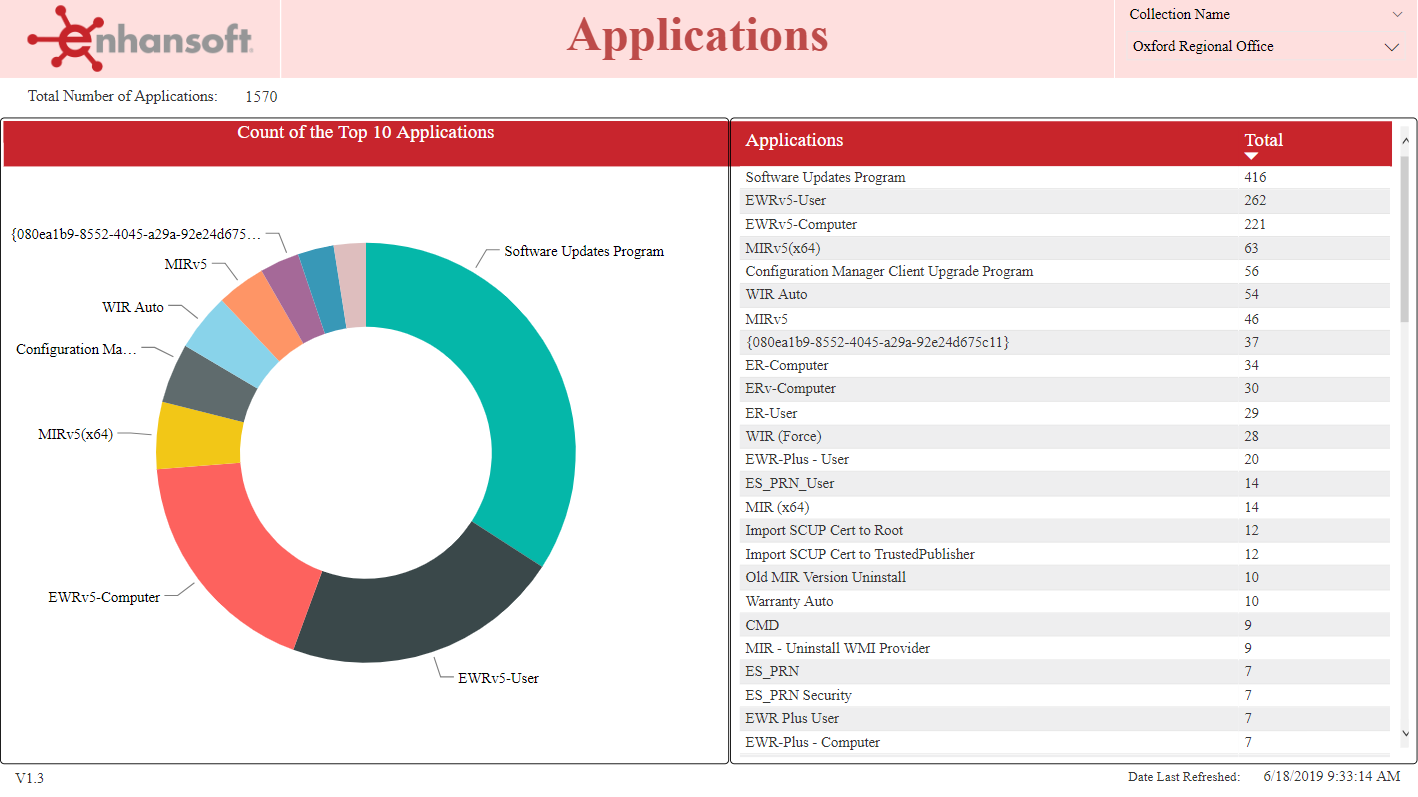
The home page shows you all of the applications installed within your SCCM environment. You can limit the results to a specific collection by using the Collection Name drop-down menu.
The donut chart on the left shows the top 10 applications, whereas, the table on the right displays all of the applications in SCCM. Both the donut chart and the table are interactive.
If you drillthrough on a specific application, you will see its related page. Power BI, by default, displays all results. Once a filter is selected, for example the Collection Name, it remains in place until replaced by another filter. Filters are generally enabled when you drillthrough from one page to another page.In the footer of all pages, you’ll see, Date Last Refreshed. This information tells you when the applications data was last queried and imported from SCCM into Power BI.
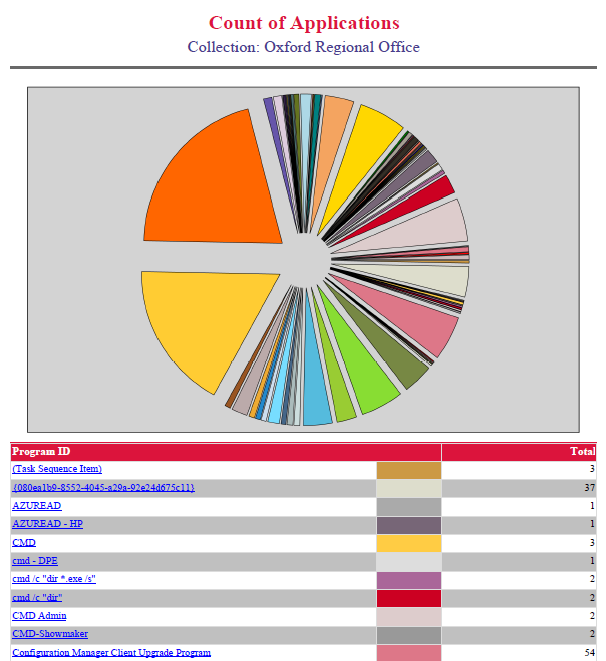
SSRS
Count of Applications returns a count of applications and packages installed within your Configuration Manager environment. Drill through from this report to List of Computers by Application, which in turn will drill through to a further report, Configuration Manager Package and Application Details.