Overall Software Update Status Home Page
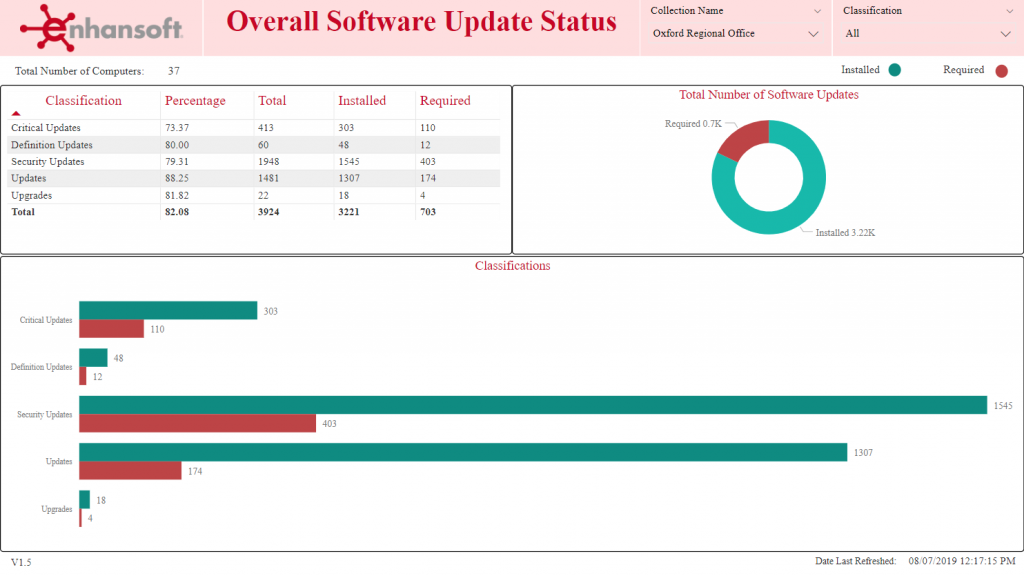
On the home page, you will see a break-down of each software update classification along the lines of the number of installed and required updates. The table shows you the total number of each software update classification and the percentage of updates that are installed. The bar graph mimics the information in the table whereas the donut chart displays the overall number of software updates that are installed and required.
From the table, bar graph and donut chart you can drillthrough to the List of Software Updates by Installed State and Classification page for additional details.
Once a filter is selected, for example, the Collection Name or software update classification, it remains in place until replaced by another filter. Filters are generally enabled when you drillthrough from one page to another page. In the footer of all pages, you’ll see, Date Last Refreshed. This information tells you when the software update classification data was last queried and imported from SCCM into Power BI.