Software Updates Dashboard
How often are you asked for the compliancy rate of the previous month’s software updates (SU)? If you are like most ConfigMgr admins, then it’s ALWAYS! Who has time, though, to do a thorough review of the entire list of SU in the ConfigMgr console? This list displays 1,000+ SU! In order to save yourself some time, you need to write what might look like an odd filtering query that only shows you last month’s SU. Don’t forget – first you must turn on (un-hide) several columns (Not Required, Total, Unknown) that are normally hidden in order for the results to make sense. Instead, wouldn’t it be nice to have a ready-made report? You can!
The Software Updates Dashboard is designed to mimic the Software Update Compliance Status report that is found within the ConfigMgr console, but our report comes with many more features! Not only can you select any year or month, but you decide what update classifications are displayed and what vendor SU are shown.
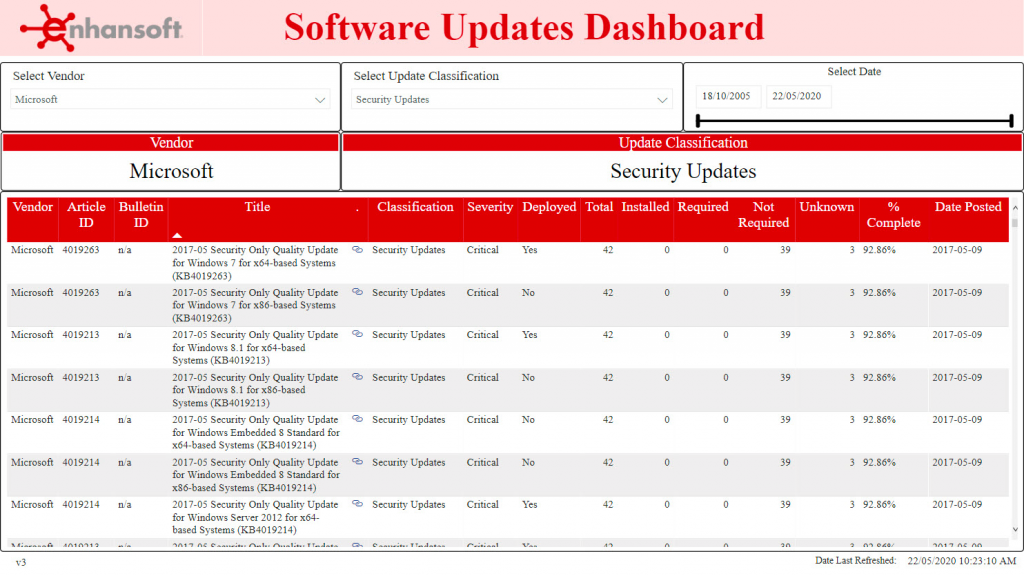
In the Power BI report version, selecting the report filters changes the results in an instant! You can print the results from both Power BI Report Server (PBRS) and Power BI Desktop (PBD). PBD also allows you to export the results to a PDF.
One of the best parts about the SSRS dashboard version is that, not only can you export it to a PDF and print it (the columns all fit on one page) but you can setup an email subscription to this report. Once a subscription is setup, the report is emailed to you at scheduled times. This feature is also available in a number of Enhansoft Reporting’s dashboards/reports. For more information about how to setup an email subscription, please see this post, How to Set-up an Email Subscription in SSRS.
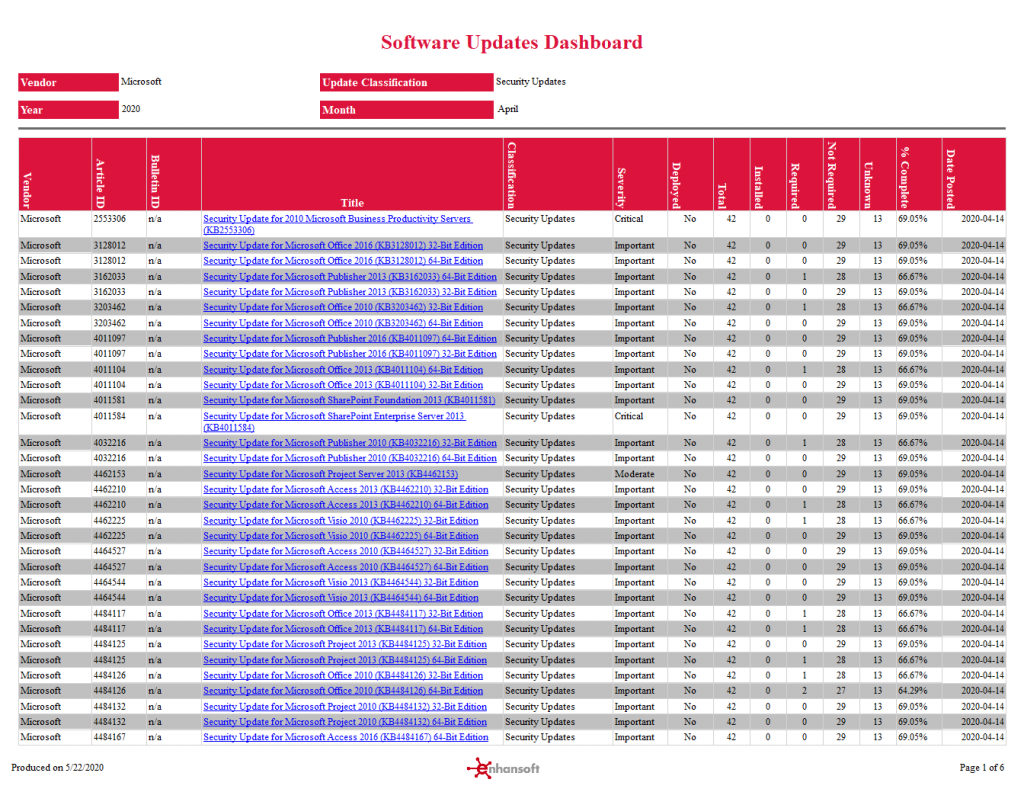
Software Updates Dashboard – Term Definitions
Total = Total Number of Computers
Installed = Count of Computers With the SU Installed
Required = Count of Computers That Require the SU
Not Required = Count of Computers Where the SU Is Not Required or Is Not Applicable
Unknown = Count of Computers Where the State of the SU Is Not Known
% Complete = Compliance Rate -In other words, (Installed + Not Required) * 100 / Total, gives you the percentage of computers that are compliant.
Power BI
SSRS
You can multi-select all of the prompt values, but there are defaults and the following are the defaults for this report.
Vendor: Microsoft
Update Classification: Security Updates
Year and Month: The previous month, e.g. June 2020 shows May 2020’s data; January 2021 will show December 2020’s SU.