Microsoft Office Add-in Home Page
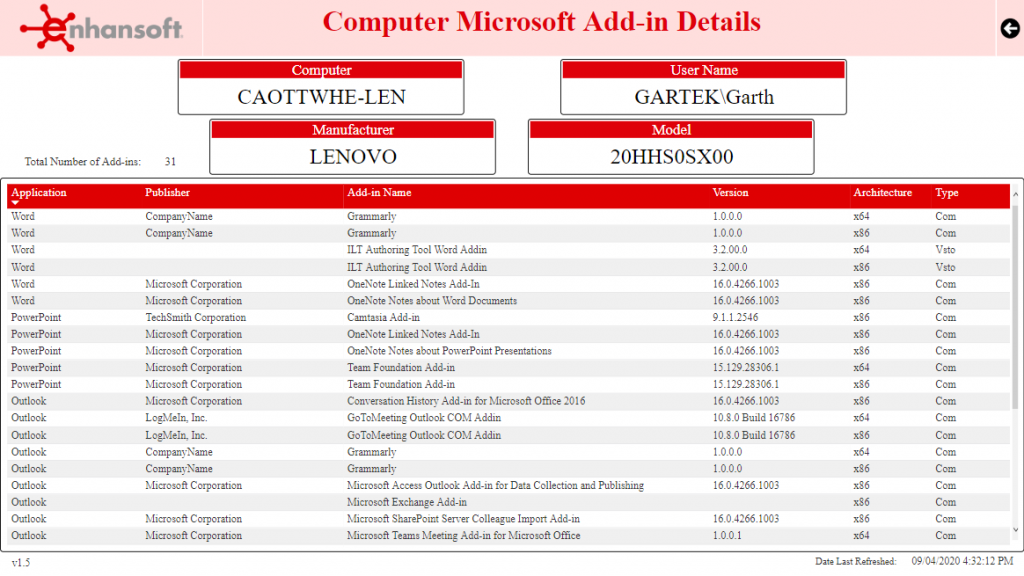
The home page shows you the number and name of each Microsoft Office add-in displayed in a chart and table. Each add-in is differentiated by color in the donut chart and each slice is interactive. The same data is also presented in a table format, which is also interactive, along with columns displaying the name of the add-in and the total count of each one. From the home page you can drillthrough to the List of Computers by Microsoft Office Add-in page for additional details.
Once a filter is selected, for example the Collection Name, it remains in place until replaced by another filter. Filters are generally enabled when you drillthrough from one page to another page.
In the footer of all pages, you’ll see, Date Last Refreshed. This information tells you when the Microsoft Office add-in data was last queried and imported from SCCM into Power BI.
Note: How to drillthrough on Power BI Desktop reports.
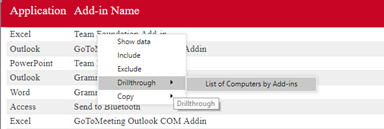
Right-click on the item you wish to drill down from and choose the option Drillthrough. A list of the possible reports you can drill-down to will appear. Simply choose the one you want by clicking on it.