Microsoft Office Dashboard
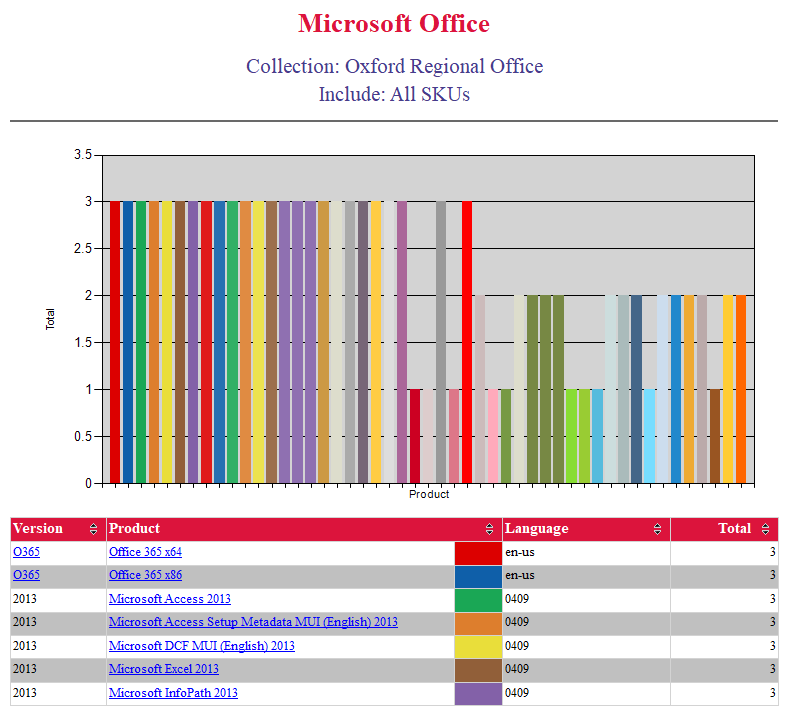
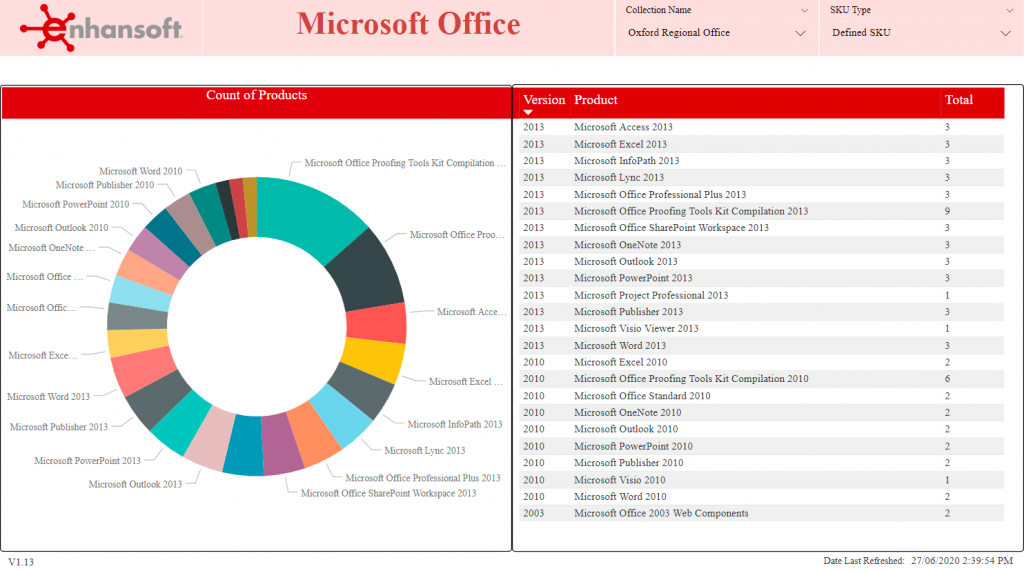
This dashboard shows you each product (sometimes called a SKU) in a chart and a table. On the Power BI home page, the donut chart differentiates the products by color and presents this data in a table format along with columns displaying the release version and total count for each product. In the SSRS dashboard, the table displays release versions and language details along with the total count for each product.
From this dashboard, depending on which version of Microsoft Office is selected, you can either drill through to the Microsoft Office 365 Dashboard or to the List of Computers by Microsoft Office Product page for additional details.
Power BI
SSRS