Management Point Usage
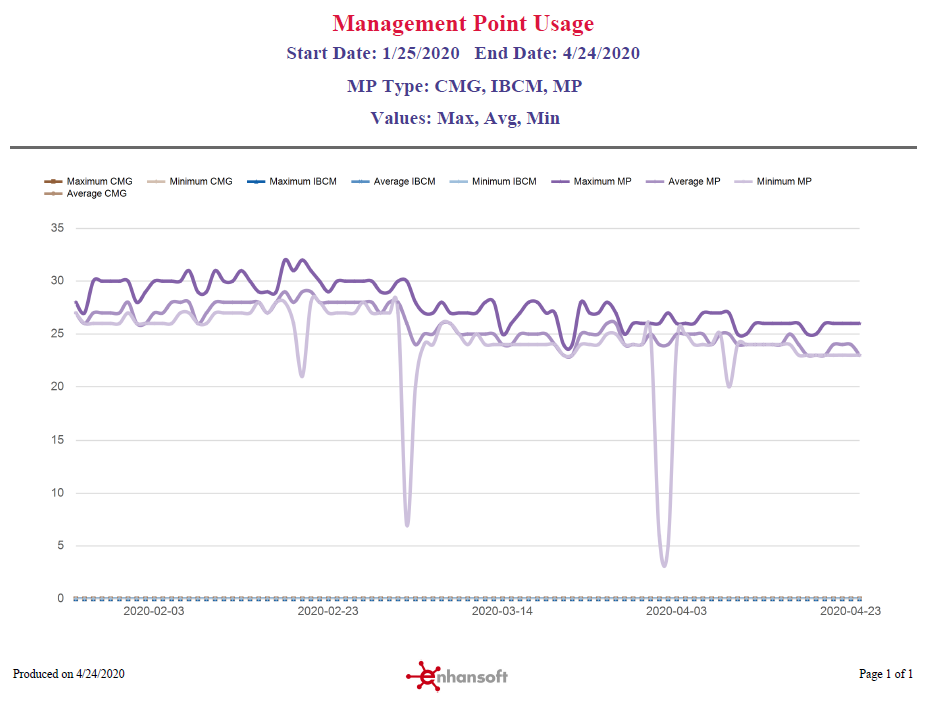
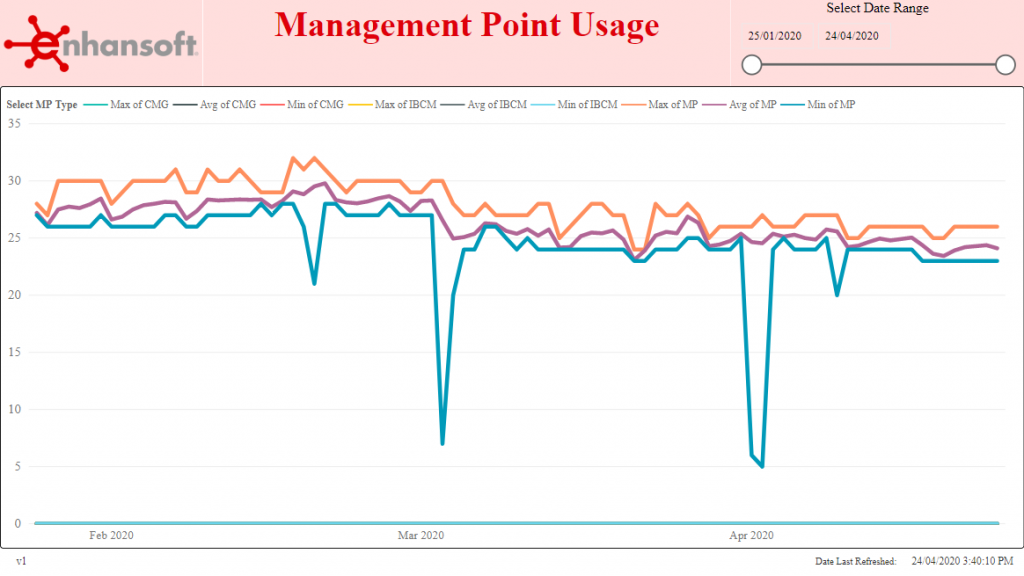
Enhansoft’s Management Point Usage report leverages the real-time data collected each hour by ConfigMgr/SCCM current branch 1810 or later. It displays the daily maximum, average and minimum usage of each management point (MP) type over a specific date range.
You can now understand trends in your environment better. When you know exactly how many ConfigMgr clients are connecting to a MP or the CMG (or even IBCM – if you still have that!) and when this number is at its lowest, you can plan downtime. You can also tell if your clients are still using VPN/direct access for ConfigMgr management.
In the SSRS version, by default, this report displays the last 14-days of usage for the three different MP types, however, you can choose any date range or MP type you want. You can filter out various MP types with the MP type prompt and see only the MPs that you want to learn more about. You can also filter out what daily value (Max, Avg, or Min) is displayed.
In the Power BI version, you can use the highlight option to highlight the MP type, and you can select the date range with the slicer option.
MP Types
- CMG (cloud management gateway)
- IBCM (internet-based client management)
- MP (the standard ConfigMgr management point)
This report is the companion report to Management Point Daily Usage.
Note: When the CMG and IBCM management points are not implemented, the result of zero (0) is listed within the chart. This also means that their graph lines might overlap with the baseline (as is shown in the report screenshots below).
Power BI
SSRS