Total Usage Trend Analysis for Collections
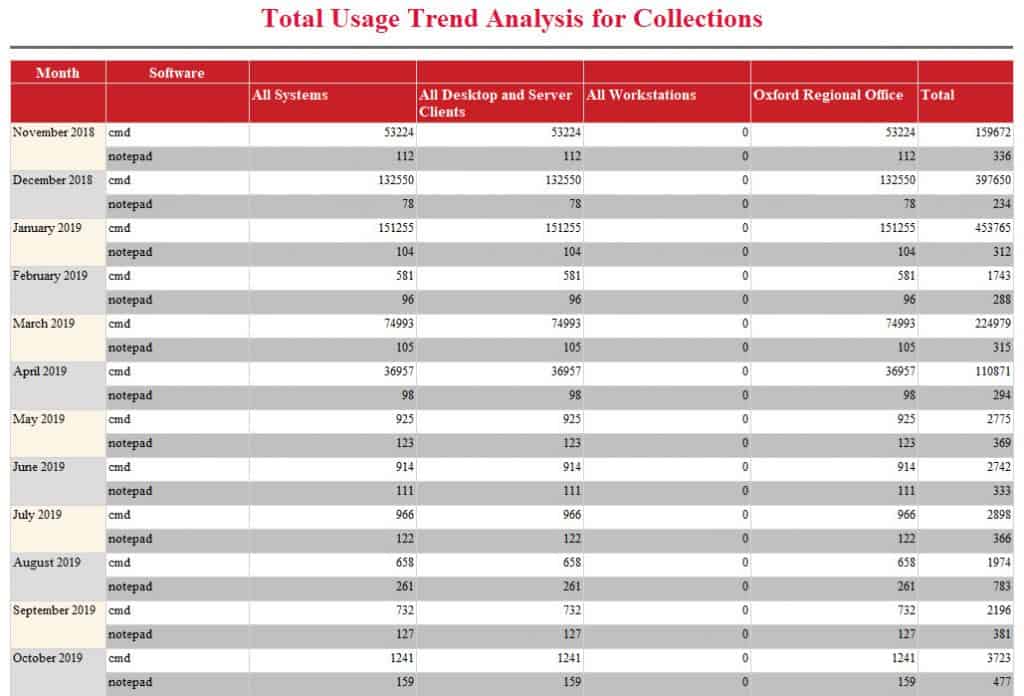
This dashboard gives you results for all applications and will display these details for up to four collections. The original request was to allow for only three collections at a time, however, we wanted to give you more options. Don’t worry, though, you don’t need to choose four collections each time you run this dashboard. Simply select the <Blank> option within the collection prompt and a zero (0) will be placed in the row for all applications within the column.
The results for each software metered application are grouped by month and they will go as far back as what is stored within your SCCM environment. Generally, this is around 9-months-to-a-year because, by default, software metering results are stored for 270 days with a maximum of 370 days.
Also, of note, unlike the SCCM built-in report, Total usage trend analysis for a specific metered software program, this dashboard compiles the User and Terminal Services Users information into one result (called Total) for each month.
Use this dashboard for one collection or up to four collections at a time!