Endpoint Protection (EP) Dashboard
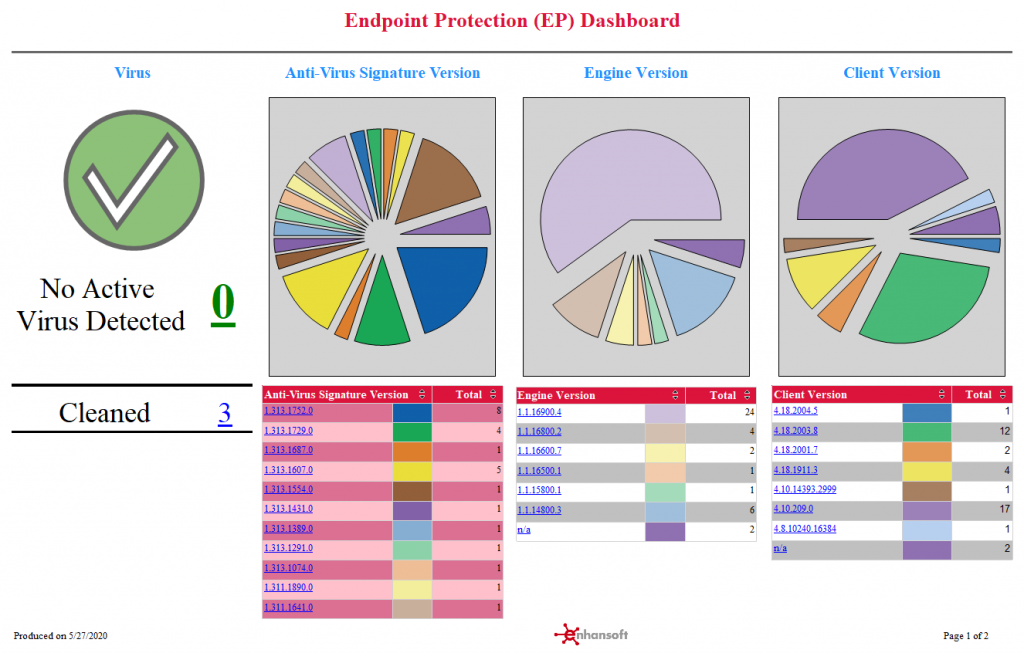
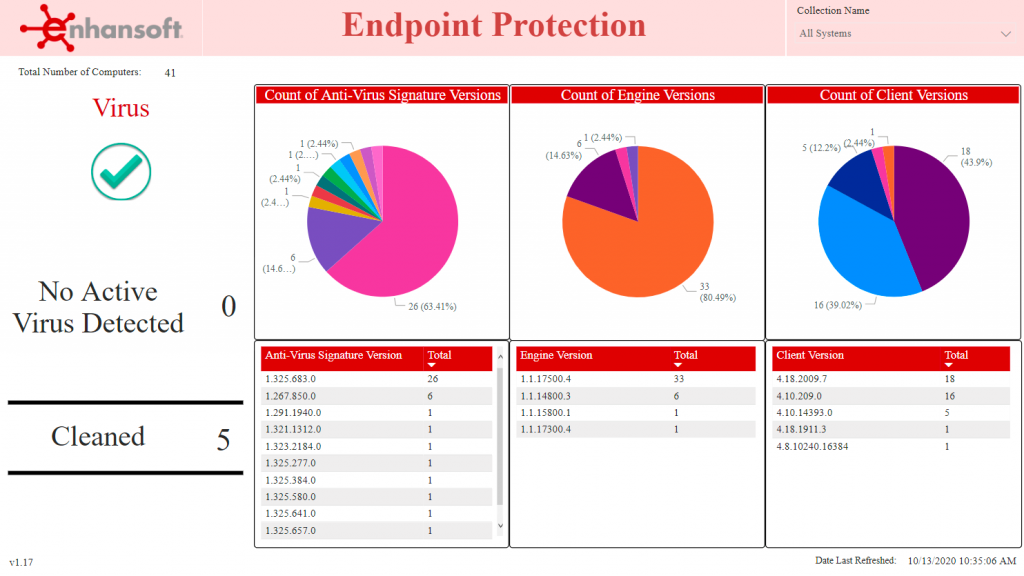
At a glance, the Endpoint Protection (EP) Dashboard displays the main details about EP that are found in your environment.
The virus detection box and the three different EP version tables are arranged from left-to-right in order to give you immediate information about viruses (either active or successfully cleaned/quarantined) and then details about the most important and frequently updated EP releases (Anti-Virus Signature) followed by the more static EP releases (Engine and Client).
Ideally, you never want to see a value greater than zero in the virus detection box. If a value greater than zero appears, you have an active virus infection. You NEED to take IMMEDIATE action. When a virus attempts to infect a computer and is either cleaned or quarantined by EP, the number of unique viruses appears next to, “Cleaned.” This is a successful state and no further action is needed.
The tables note each release update and display the total number of out-of-date computers per update. The latest version update appears on the top row of every table’s column. In a perfect world, all computers have the latest update, but this is virtually impossible for Anti-Virus Signature (AVS) as Microsoft releases AVS 3 or 4 times a day. In order to assist you, the AVS table uses two shades of light red to highlight the total number of computers with an out-of-date AVS of more than 14 days.
From this dashboard, you can drill through to the reports, List of Computers by EP Detected Viruses, List of Computers by EP Anti-Virus Signature Version, List of Computers by EP Client Version, and List of Computers by EP Engine Version.
Notes:
1. If the “n/a” (not available) value appears in any of the dashboard’s table reports, it most likely means that those computers do not have anti-virus software. This should be investigated as soon as possible.
2. The EP Client is sometimes referred to as Platform.
Power BI
SSRS